California Tide Tables
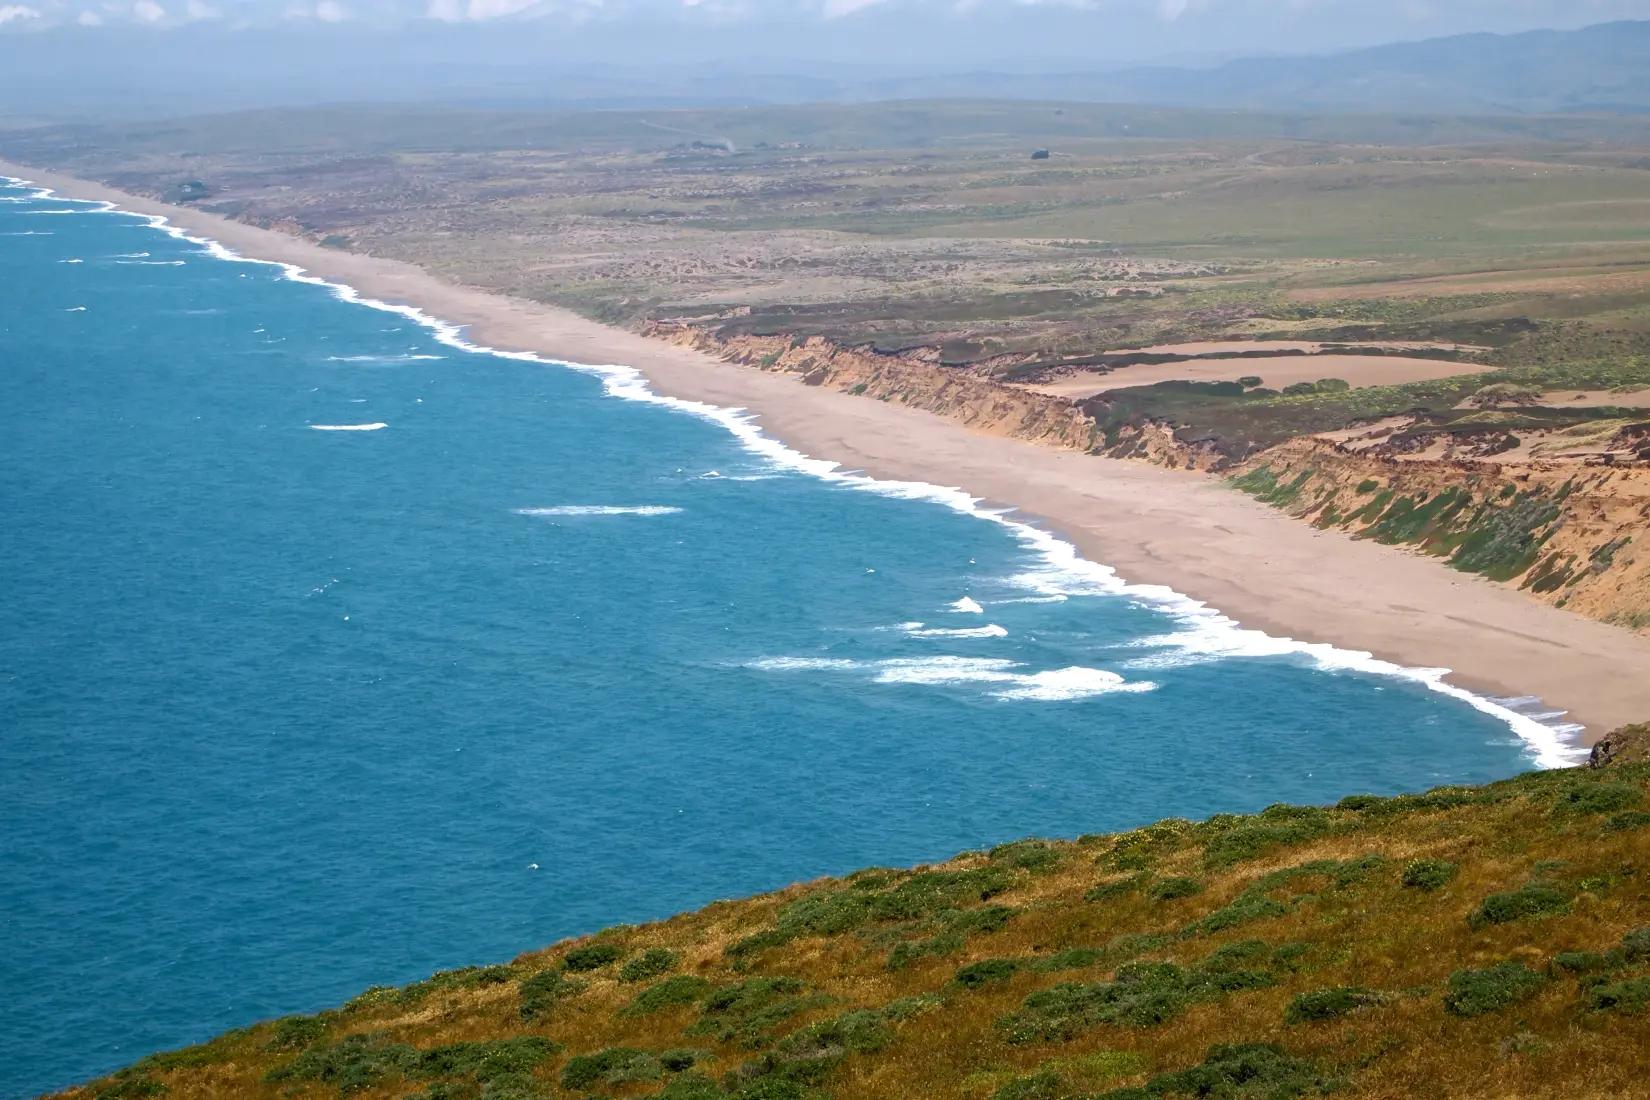
California is home to some of the most beautiful beaches in the world, and the state's tides play a big role in creating that beauty. The rising and falling of the tides exposes and uncovers different parts of the beach, creating a ever-changing landscape that is perfect for exploring.
If you're planning a trip to California, it's important to know the tide tables so you can plan your activities accordingly. This blog post will provide you with everything you need to know about California tides, including average tide heights, how they vary throughout the year, and how they differ in different parts of the state.
Average Tide Heights
The average tide height in California varies depending on the location. The following table shows the average tide heights for some of the state's most popular beaches:
Beach
Average High Tide Height (ft)
Average Low Tide Height (ft)
Santa Monica Beach
3.5
1.0
Malibu Beach
4.0
0.5
Huntington Beach
2.5
0.5
La Jolla Shores
3.0
0.5
Monterey Bay
6.0
1.0
Tide Variation Throughout the Year
The tides in California also vary throughout the year. The highest tides occur in the winter months, when the moon is closest to the Earth. The lowest tides occur in the summer months, when the moon is furthest from the Earth.
The following graph shows the average tide heights for Santa Monica Beach for each month of the year:

As seen by the upward sloping trendline throughout the year, the most consistent high tides (and thus waves) occur in December and January, when the average high tide height is 4.0 feet. The lowest tides occur in June and July, when the average low tide height is 0.5 feet.
Tides in Different Parts of California
The tides in California also vary depending on the location. The following table shows the average tide heights for different parts of the state:
Region
Average High Tide Height (ft)
Average Low Tide Height (ft)
North California
3.0
0.5
Central California
4.0
0.5
Southern California
5.0
1.0
As you can see, the tides are generally higher in Southern California than in North or Central California. This is because Southern California is closer to the equator, which means that the gravitational pull of the moon is stronger.
How to Use Tide Tables
Tide tables are available online and at most libraries. They typically list the predicted tide heights for each day of the year, along with the time of high tide and low tide.
To use a tide table, first find the date of your trip. Then, look up the predicted tide heights for that day. This will tell you how high and low the tide will be at different times of the day.
You can use this information to plan your activities accordingly. For example, if you want to go swimming, you'll want to go at high tide when the water is deepest. If you want to go tidepooling, you'll want to go at low tide when the water is lowest.
Conclusion
California's tides are a beautiful and ever-changing phenomenon. By understanding the tide tables, you can plan your activities accordingly and make the most of your trip to the Golden State.